
When an agent answers a question, a lot happens behind the scenes. It reasons about the query, decides which tools to call, waits for results, reasons again, and eventually produces a response. Until now, that process was a black box. You saw the input and the output, but not the journey between them.
That changes with agent tracing.
Tracing gives you a complete, step-by-step breakdown of every action an agent takes during a conversation. Every LLM call, every tool invocation, every round of reasoning. All of it, timestamped and measurable.
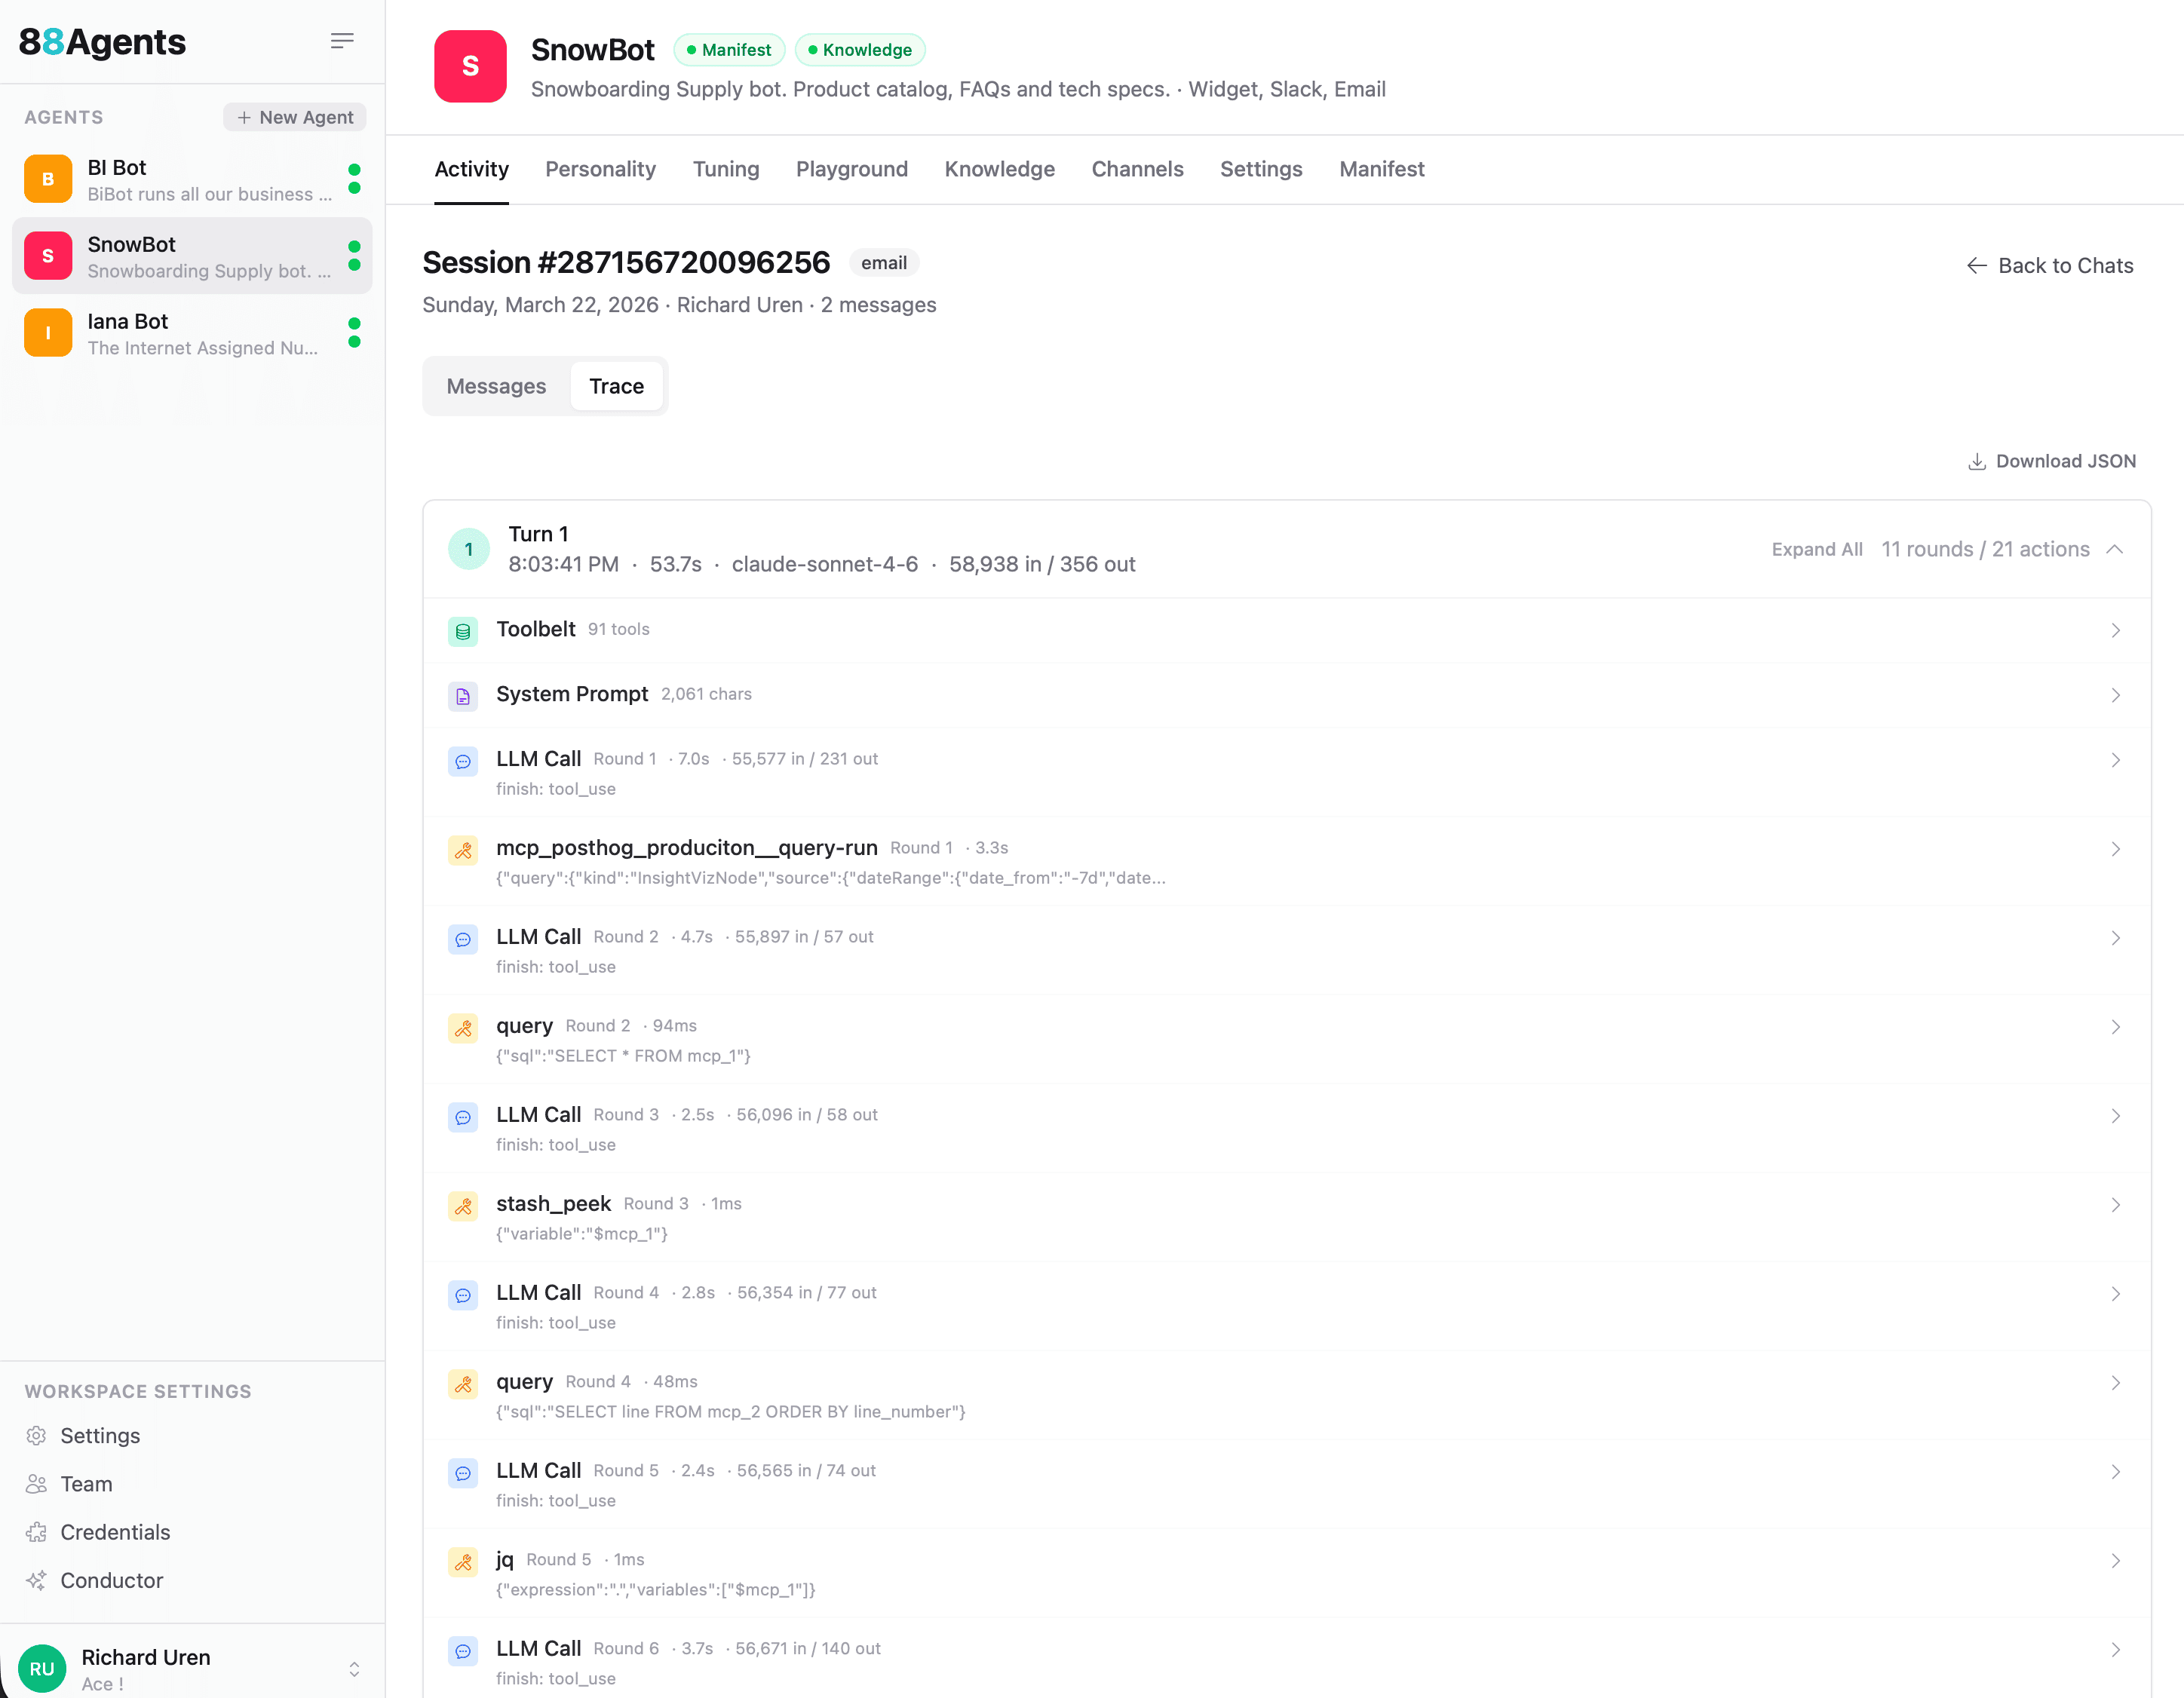
What You See in a Trace
Each conversation turn is broken down into its component parts:
- LLM Calls: every call to the model, with input/output token counts and latency. You can see exactly how long each round of reasoning took and how much context was consumed.
- Tool Invocations: every tool the agent called, what arguments it passed, and how long the tool took to respond. Whether it’s querying PostHog, running SQL, peeking at stashed data, or calling an MCP tool, it’s all there.
- Rounds and Actions: the trace groups everything into rounds, so you can follow the agent’s chain of thought. Round 1: call the LLM, it decides to use a tool. Round 2: feed the tool result back, it decides to query again. And so on until it has what it needs.
- System Prompt: the full system prompt that was active for the conversation, including character count.
- Toolbelt: the complete set of tools available to the agent for that session.
In the example above, a single turn involved 11 rounds and 21 actions, using claude-sonnet-4-6 with 58,938 tokens in and 356 out, completing in 53.7 seconds. That level of detail makes it straightforward to spot what’s slow, what’s expensive, and what’s unnecessary.
How Does This Help?
Agents that use tools are powerful but unpredictable. An agent with access to MCP tools might take a completely different path depending on the question, the data it finds, and the tools available to it. When something goes wrong (a bad answer, a slow response, unexpected token usage) you need to know what happened.
Without tracing, debugging means reading through conversation logs and guessing. With tracing, you can see the exact sequence: the agent called PostHog, got the data, ran a SQL query to reshape it, peeked at the result, ran another query, transformed it with jq, and finally composed the response. If step 4 took 12 seconds, you know where to look.
Tracing also helps with cost management. Token counts are visible at every step, so you can see where the budget is going. If an agent is burning through tokens on a particular type of query, the trace shows you exactly which rounds are expensive and why.
How to Enable Tracing
Tracing is opt-in. Head to Settings > Logging in your agent’s workspace and enable trace logging. Once it’s on, every conversation will have a Trace tab alongside the Messages tab in the activity view.
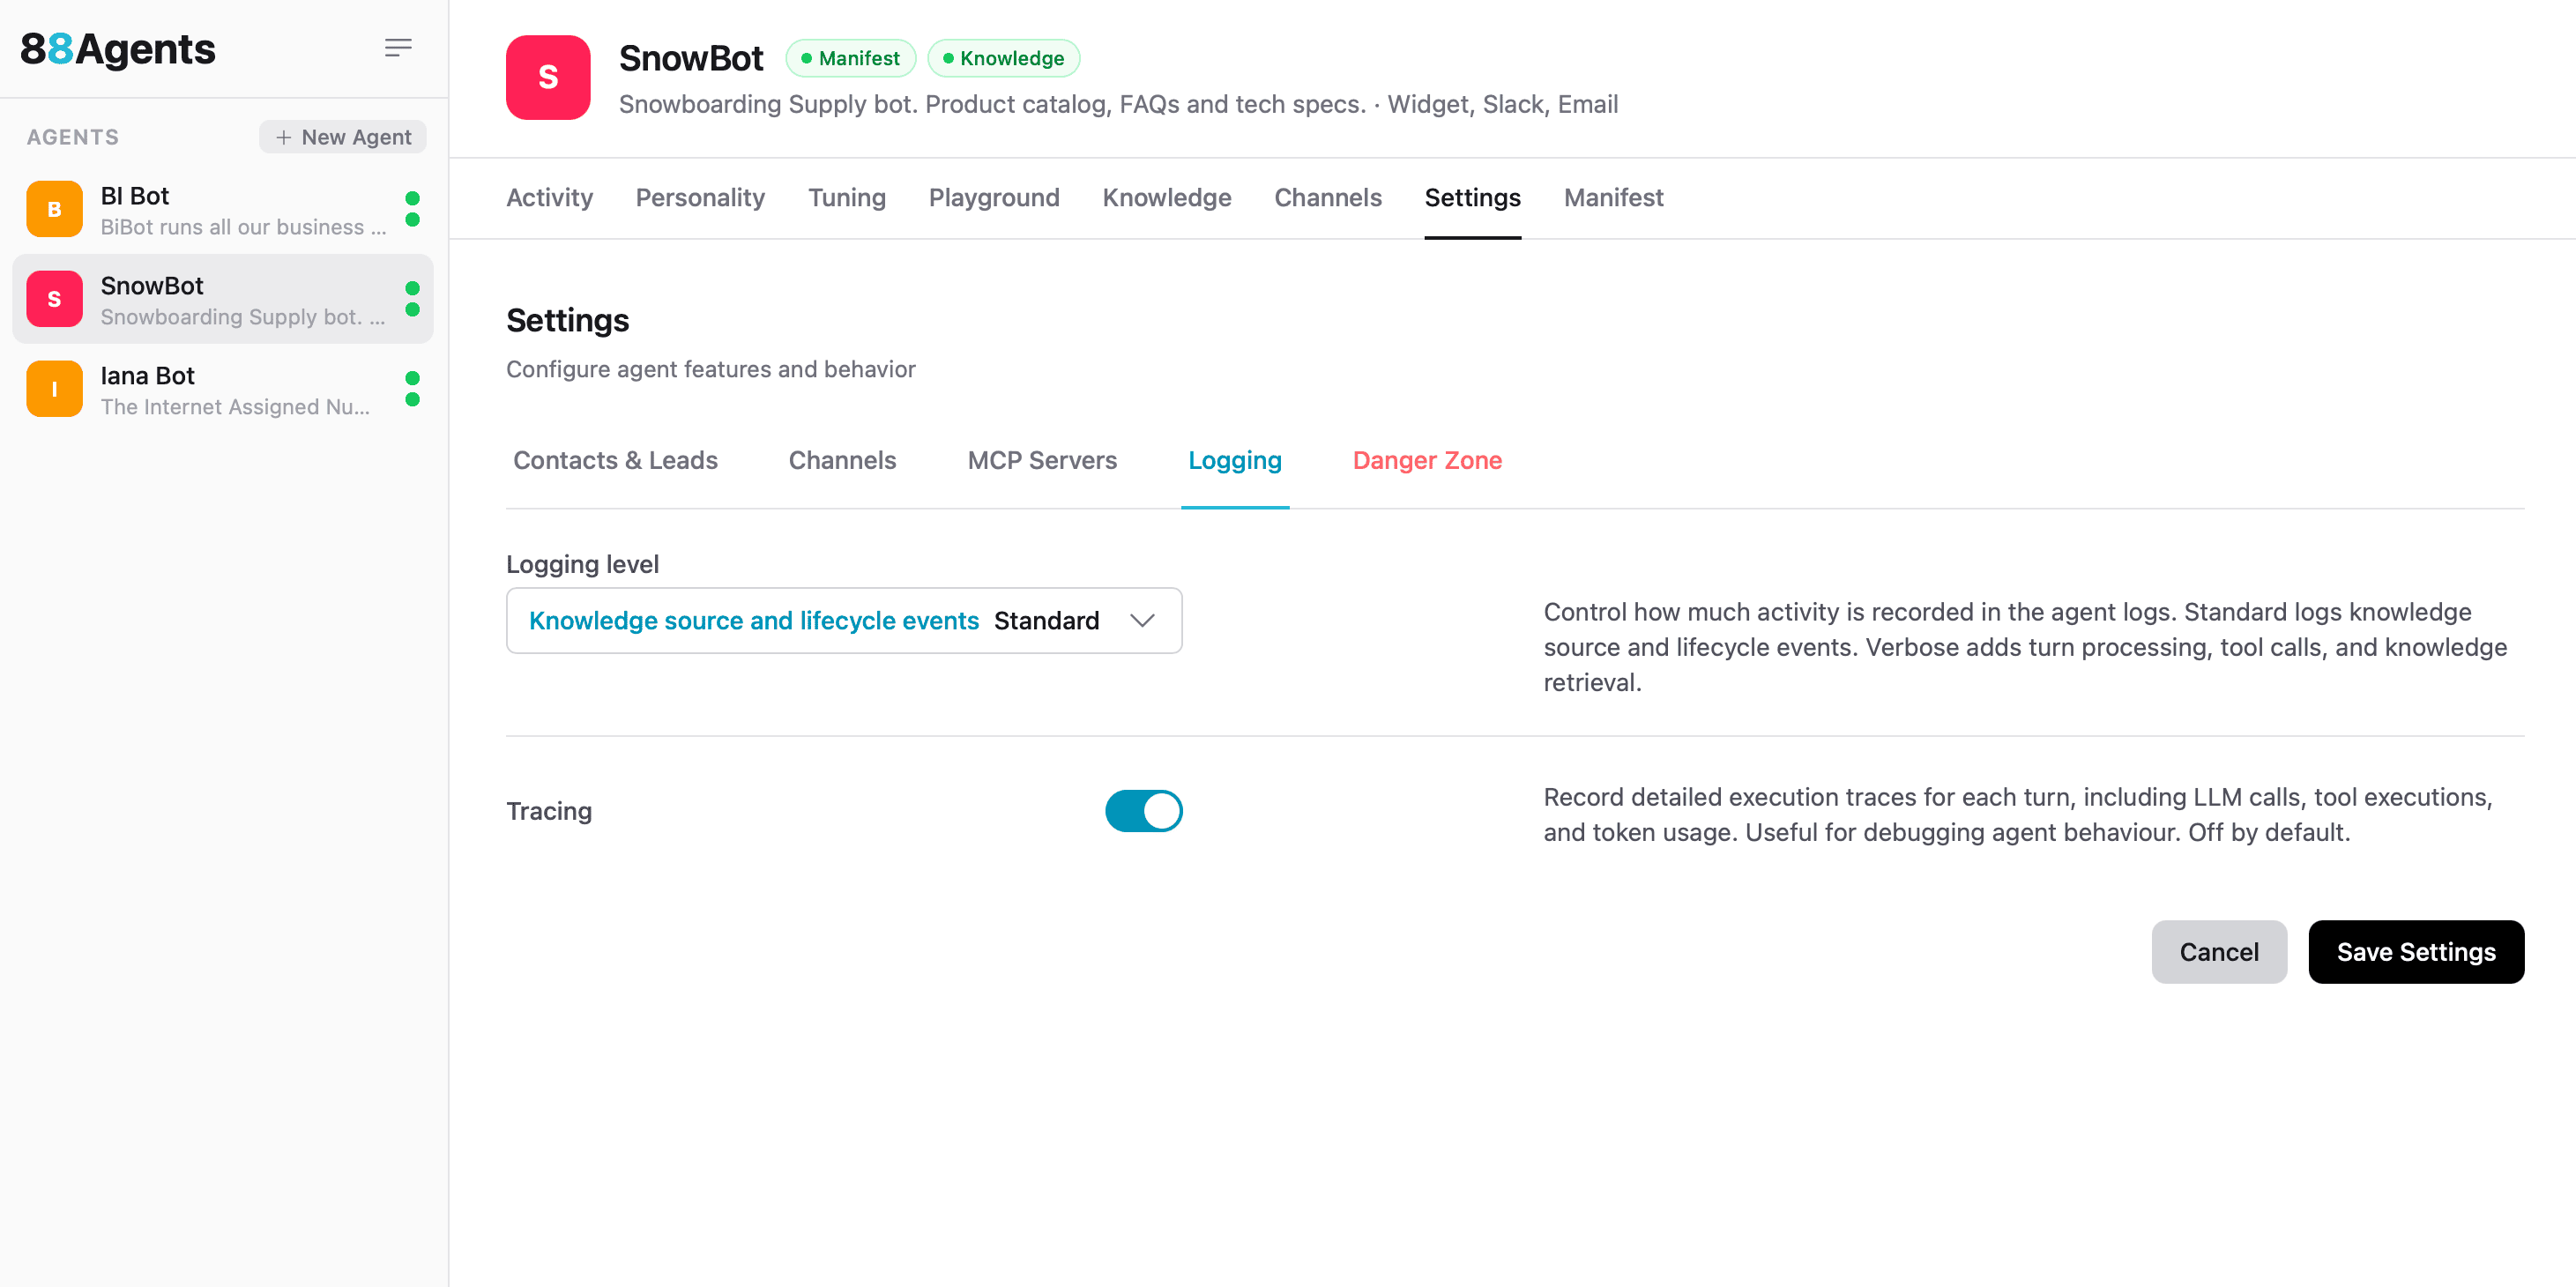
Tracing is opt-in because it adds some overhead to the tool loop and not every team needs that level of visibility for every conversation. Tracing is super powerful when combined with Evals (coming soon). 🤩 But when you’re debugging, optimising, or just curious about how your agent thinks, it’s invaluable.
Export Everything
Every trace can be downloaded as JSON. Click Download JSON in the trace view and you get the complete execution log. Structured, machine-readable, and ready for analysis. Pipe it into your own observability stack, build dashboards around tool usage patterns, or just keep it for your records.
The JSON includes everything: timestamps, token counts, tool arguments, model identifiers, round numbers, and finish reasons. It’s the full picture.
What This Unlocks
With tracing in place, a few things become possible that weren’t before:
- Performance tuning: identify which tools are slow and which rounds are redundant
- Cost attribution: see exactly how many tokens each type of query consumes
- Debugging agent behaviour: understand why an agent chose one tool over another
- Client reporting: show clients exactly what their agent is doing under the hood
- Quality assurance: verify that agents are following the expected reasoning paths
For agencies managing multiple client agents, this is the kind of transparency that builds trust. When a client asks “what does my agent actually do when someone asks about pricing?”, you can show them the trace.
Try It
Enable tracing in Settings > Logging, run a conversation, and click the Trace tab. It’s one of those features that, once you’ve seen it, you’ll wonder how you worked without it.